

Introduction — a quick on-site scene, some hard numbers, one blunt question
I remember standing under a noisy roof of pantographs at dawn, coffee in hand, watching a tram limp into the bay. The depot had a half dozen chargers, but three of them were offline that week. Pantograph charger uptime looked great on the paper sheet — until you face the real shift schedule and the rush (it slaps you in the face). Data points matter: fleets report downtime hitting 12–30% during peak seasons, and every minute lost costs money and rider trust. So, what does a realistic fix look like for operators and tech teams? I’ll walk you through my take — practical, a little blunt, and rooted in what actually breaks on the ground.
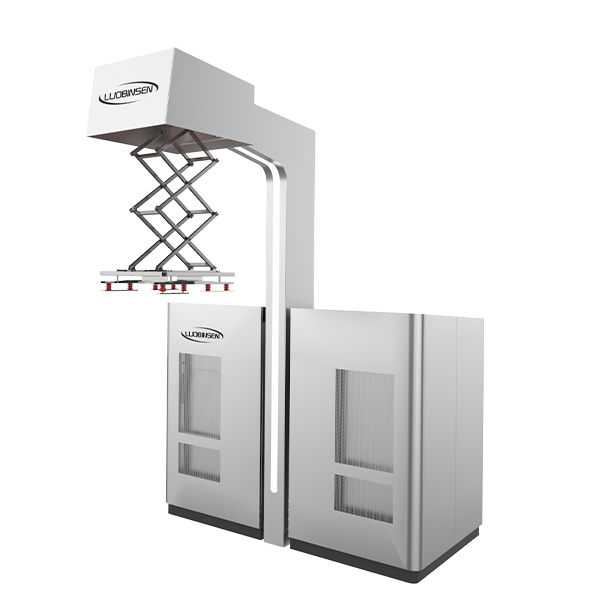
Part 2 — Why the pantograph charging solution still trips up fleets
At first glance, the pantograph charging solution seems obvious: connect, charge, go. But the real problems hide below that simple loop. Old designs assume ideal alignment between pantograph head and overhead conductor. They ignore real-world sways, worn contact surfaces, and the messy electrical transients that hit power converters. In my experience, maintenance cycles and diagnostic tools haven’t kept pace. Fault logs? Sparse. Alert noise? Loud. That mismatch creates surprise failures and longer fixes.
So what actually fails most?
Most failures trace to a few culprits: mechanical wear at the pantograph head, poor contact resistance, and weak thermal management in power converters. Add in inconsistent monitoring — and you get repeat breakdowns. Look, it’s simpler than you think: better sensors and clearer alerts reduce repeated truck rolls. We need smarter fault detection (edge computing nodes, targeted telemetry) and—or—improved contact design. I’m not saying it’s easy, but the path forward is clear.
Part 3 — New principles and a short road map for the next-gen electric ev charging station
Moving forward, I focus on two things: predictable uptime and fast, measurable repairs. New technology principles—modular power converters, adaptive contact systems, and distributed diagnostics—give us a fighting chance. Imagine each bay as an intelligent node that reports temperature, contact impedance, and alignment in real time. That data feeds short loops of automated checks and only raises human alerts for confirmed faults. It’s not magic; it’s engineering plus good ergonomics.
What’s Next?
Case examples show fast wins: retrofitting a few sensors cut average repair time by 35% in one depot I know. Future outlook? More software in the loop, better predictive maintenance, and standard telemetry formats so teams don’t chase different dashboards. — funny how that works, right? We’ll also see tighter integration between vehicle controls and charging stations, reducing handshake delays and improving safety. Small changes, measured results. Big payoff.
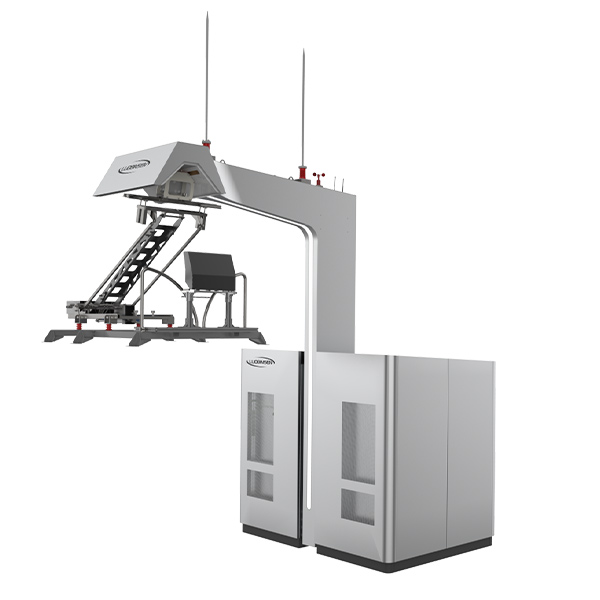
Closing — how I’d evaluate a pantograph solution (three quick metrics)
Here are three practical metrics I use when evaluating systems: 1) Mean Time To Repair (MTTR) under field conditions — not lab claims. 2) True uptime percentage over a rolling 90-day window, including partial-derate events. 3) Diagnostic clarity: can a technician identify the root cause from the first alert? These metrics force vendors to show real behavior, not glossy brochures. I prefer partners who share raw logs and who plan for iterative fixes. That tells me they expect to learn and improve.
In short: simple checks, better telemetry, and honest metrics. That’s how we stop surprises and keep fleets moving. For solutions that follow these ideas, I look to proven suppliers who back performance with data. For me, that includes keeping an eye on manufacturers like Luobisnen, who publish specs and support field tweaks without the sales fluff.
